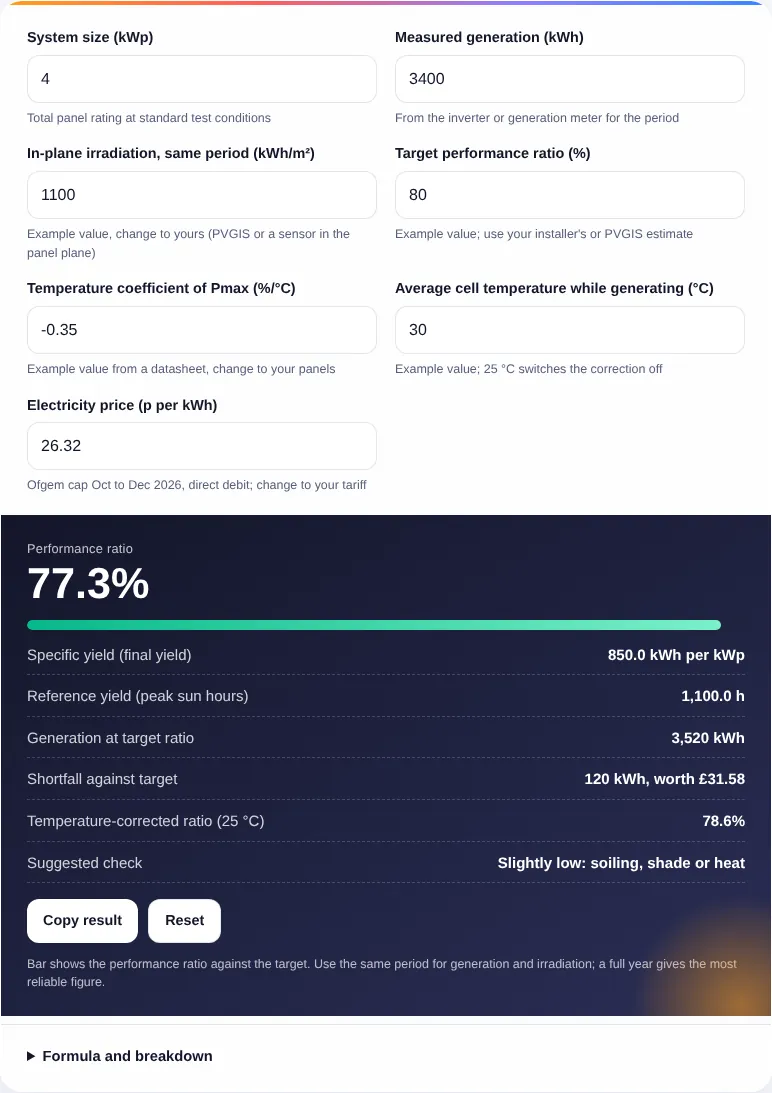
Bar shows the performance ratio against the target. Use the same period for generation and irradiation; a full year gives the most reliable figure.
Formula and breakdown
n/a
n/a
n/a
This solar performance ratio calculator tells UK, Irish and European solar owners and installers how much of the sunlight reaching their panels ends up as useful electricity, and whether a system is underperforming. Enter the generation from your inverter, the system size and the irradiation on the panel plane for the same period, and it returns the performance ratio, the shortfall against a target in kWh and pounds, and a temperature-corrected figure.
Quick answer: A solar performance ratio calculator divides specific yield (kWh per kWp) by in-plane irradiation (kWh/m², the same as peak sun hours). A 4 kWp system producing 3,400 kWh under 1,100 kWh/m² has a ratio of 850 / 1,100 = 77.3%. Wikipedia notes modern solar parks typically exceed 80%.

What Is a Solar Performance Ratio Calculator?
A solar performance ratio calculator is a tool that compares the energy a PV system actually delivered with the energy its panels would have produced at their rated efficiency under the sunlight that reached them. In plain words: performance ratio equals generation in kWh divided by (system size in kWp multiplied by in-plane irradiation in kWh/m²).
The ratio removes the weather from the comparison. A sunny year raises generation and irradiation together, so the ratio stays about the same unless something in the system changes. The Wikipedia article on photovoltaic system performance describes it as the AC output delivered as a proportion of the DC power the modules should deliver under the ambient conditions. The ratio captures every loss together: heat, dirt, shading, wiring, inverter conversion and downtime.
Two intermediate figures make the sum easy to check. The final yield is generation divided by kWp, the same number our kWh per kWp calculator gives. The reference yield is the in-plane irradiation divided by the standard test irradiance of 1 kW/m², which is why it equals peak sun hours.
How Do You Use the Solar Performance Ratio Calculator?
- Enter the system size in kWp, the sum of the panel ratings.
- Enter the generation for a period from the inverter app or generation meter. A full year is best; single months are noisy.
- Enter the in-plane irradiation for exactly the same period, from a sensor mounted at the panel angle or from PVGIS for your tilt and orientation.
- Set a target ratio. If you have a PVGIS or installer estimate, the target is that estimate’s generation divided by (kWp x its irradiation).
- Optionally add the panels’ temperature coefficient and an average cell temperature to see how much of the gap heat explains.
- Read the shortfall in kWh and its value at your unit price, then follow the suggested check.
What Is a Good Performance Ratio for Solar Panels?
A well-run modern system typically scores in excess of 80%, the figure Wikipedia gives for modern solar parks, and a home roof with some shading or a hot summer can sit a few points lower. There is no single pass mark, because roof temperature, shading, inverter sizing and the irradiation source all move the result, so compare against a target built for your own system rather than a generic number.
PVGIS, the European Commission’s solar tool, is a useful way to set that target. Its user manual uses a default of 14% for overall system losses such as cables, inverter, dirt and ageing, and models temperature and spectral effects separately. The ratio implied by a PVGIS estimate is therefore below 86%, because those modelled temperature and spectral losses come on top of the 14%.
Why Is My Solar Performance Ratio Low?
A ratio more than about 5 points below target usually means a fixable problem rather than weather: shading that has grown, heavy soiling, a string or optimiser that has dropped out, or an inverter that tripped and sat offline for days. The table gives the order we suggest for checking, from the result the solar performance ratio calculator shows.
| Result against target | What it often means | Sensible first checks |
|---|---|---|
| At or above target | System working as expected | Keep logging monthly generation |
| Up to 5 points below | Normal spread, soiling, heat or light shade | Compare with last year, look for new shade from trees |
| 5 to 15 points below | Persistent loss | Inverter error log, days with zero output, clipping at midday |
| More than 15 points below | Part of the array likely not producing | Ask the installer to test strings and optimisers |
| Above 100% | Data problem | Irradiation period, sensor angle or kWp figure |
Do not climb onto the roof or open DC isolators and connectors yourself. PV strings carry DC voltage whenever light falls on the panels; fault-finding should be done by the installer or a qualified electrician, and in the UK any electrical work must meet BS 7671. If the array faces east or west, our solar panel orientation calculator shows how much yield the direction costs, which belongs in the target rather than the fault list.
How Much Does Temperature Lower the Performance Ratio?
Each degree of cell temperature above 25 °C cuts output by the panel’s temperature coefficient of Pmax, so a panel at 45 °C with a coefficient of minus 0.35%/°C loses about 7%. The solar performance ratio calculator divides the measured ratio by this factor to show what the ratio would be at 25 °C. If the corrected figure reaches the target, heat explains the gap and nothing is broken.
| Temperature coefficient | Cell at 25 °C | Cell at 35 °C | Cell at 45 °C |
|---|---|---|---|
| minus 0.30%/°C | 1.000 | 0.970 | 0.940 |
| minus 0.35%/°C | 1.000 | 0.965 | 0.930 |
| minus 0.40%/°C | 1.000 | 0.960 | 0.920 |
The factors are 1 + coefficient x (cell temperature minus 25). Use the coefficient from your panel datasheet; the solar panel temperature loss calculator estimates cell temperature from air temperature and NOCT. Panels also lose a little output each year as they age, which lowers the ratio slowly over the decades.
Can the Performance Ratio Be Over 100%?
No, not for a standard single-sided array measured correctly: a result above 100% means the irradiation or generation figure is wrong. Common causes are irradiation for a horizontal surface used with tilted panels, a different date range, a shaded or dirty sensor, or an understated kWp. The solar performance ratio calculator flags this case instead of reporting it as a good result. Bifacial panels collect light from the rear as well, so their ratio needs a different reference.
Worked Example: Checking a Year of Generation
Example: a 4 kWp south-facing system in the Midlands produced 3,400 kWh in a year. PVGIS, for the same tilt and orientation, gives 1,100 kWh/m² of in-plane irradiation (an example figure; look up your own roof). The installer’s estimate implies a target of 80%. The panels have a coefficient of minus 0.35%/°C and spent the productive hours at about 30 °C on average.
- Final yield: 3,400 / 4 = 850 kWh per kWp.
- Reference yield: 1,100 kWh/m² / 1 kW/m² = 1,100 hours.
- Performance ratio: 850 / 1,100 = 77.3%.
- Generation at target: 0.80 x 4 x 1,100 = 3,520 kWh, so the shortfall is 120 kWh.
- Value at the Ofgem cap of 26.32p per kWh: 120 x 0.2632 = £31.58 a year.
- Temperature factor: 1 + (minus 0.0035 x 5) = 0.9825; corrected ratio 77.3% / 0.9825 = 78.6%.
The result sits 2.7 points below target and heat explains about half of it, so the system is healthy. A look for new shade and a comparison with the previous year are enough. The solar panel output calculator turns any target ratio into a monthly generation forecast for next year’s check.
Frequently Asked Questions
How do you calculate the performance ratio of a solar system?
Divide the generation in kWh by the system size in kWp to get the specific yield, then divide that by the in-plane irradiation in kWh/m² for the same period. For 3,400 kWh from 4 kWp under 1,100 kWh/m², the ratio is 850 divided by 1,100, which is 77.3%.
What is a good performance ratio for a home solar system?
Modern solar parks typically exceed 80%, and a well-designed home system with little shade often lands in the high seventies or low eighties. The useful test is your own target, from PVGIS or the installer’s estimate, rather than a single national figure, because orientation, shading and temperature differ.
Where do I get the irradiation figure?
The most accurate source is a sensor mounted at the same tilt and direction as the panels. Without one, PVGIS gives monthly and yearly in-plane irradiation for your location, tilt and orientation, as long-term averages. Averages suit annual checks; single months can differ a lot from the long-term figure.
Is performance ratio the same as panel efficiency?
No. Panel efficiency is the share of sunlight a module converts at standard test conditions, and it is printed on the datasheet. Performance ratio compares real system output with that rated output under the actual sunlight, so it measures the system’s losses, not the panel technology.
Why is my performance ratio lower in summer?
Panels lose output as they heat up, by their temperature coefficient for each degree above 25 °C, and on a bright summer day cells run well above that. Inverter clipping on bright days adds to the drop. Winter ratios can look higher, though low sun and snow add their own losses.
How often should I check my performance ratio?
Once a year with annual totals gives the most reliable comparison, and a quick monthly look helps spot a sudden fault such as a tripped inverter. Compare each month with the same month last year rather than with a fixed number, because seasonal effects change the ratio.
Checked October 2026 by the Solaxyra Editorial Team. Sources: Wikipedia: Photovoltaic system performance, European Commission JRC: PVGIS user manual, DNV SolarFarmer: Performance ratio definition, Ofgem: price cap 1 October to 31 December 2026.