Bar shows your annualised yield as a share of the benchmark (full bar = 120%).
Formula and breakdown
Specific yield = energy / system size
This kWh per kWp calculator turns the electricity your solar panels actually generated into specific yield, so homeowners in the UK, Ireland and the rest of Europe can see whether a system is performing as it should. Enter the system size, a meter reading and the number of days it covers, and it compares the result with measured UK data or a figure you choose.
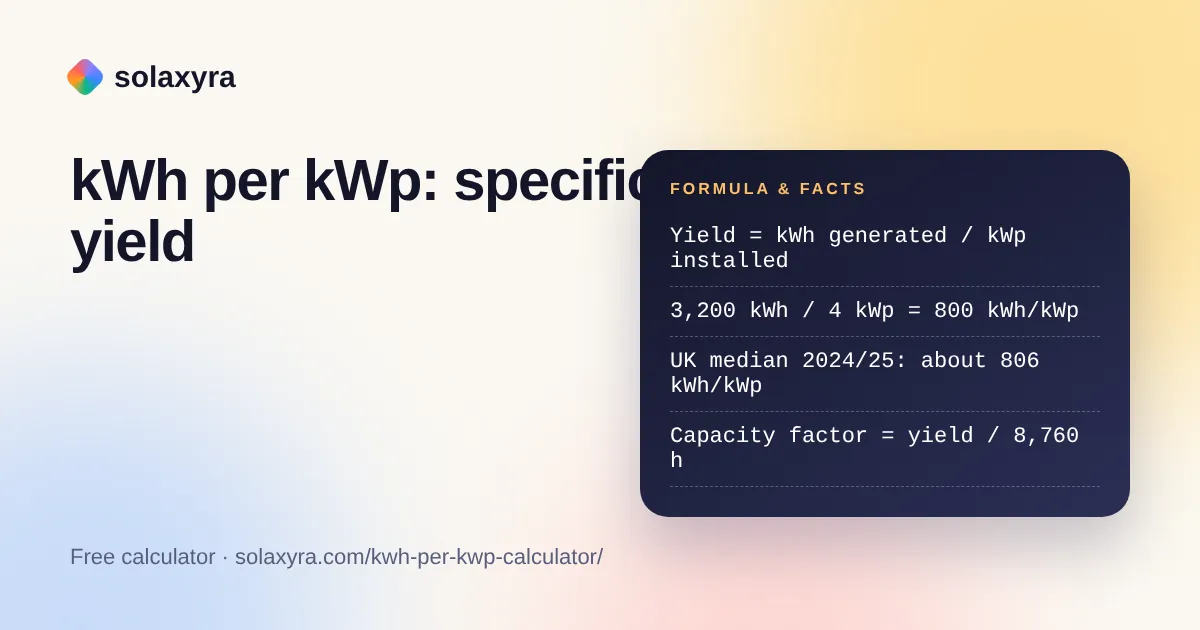
Quick answer: A kWh per kWp calculator divides the electricity your panels generated by the system’s peak power. A 4 kWp system that made 3,200 kWh in a year has a specific yield of 800 kWh/kWp. UK government analysis of 2024/25 meter readings found a median load factor of 9.2%, about 806 kWh/kWp.
What Is a kWh per kWp Calculator?
A kWh per kWp calculator is a tool that measures how much energy a solar PV system produces for each kilowatt of installed peak power, a figure known as specific yield. In plain words, you take the kilowatt hours generated over a period and divide them by the system’s rated size in kWp. Because the size cancels out, the answer lets you compare a small 2 kWp roof with a 10 kWp roof on equal terms.
The kWp figure is the DC power the panels are rated to deliver under standard test conditions. The European Commission’s PVGIS user manual defines these conditions as 1,000 W of sunlight per square metre on the panels at a panel temperature of 25 C. Real roofs rarely see both at once, which is why yearly specific yield is far below 8,760 kWh per kWp, the figure you would get if a system ran flat out every hour of the year.
Three related figures come out of the same sum:
- Specific yield (kWh/kWp) = energy generated / system size.
- Average daily yield (kWh/kWp per day) = specific yield / number of days.
- Capacity factor or load factor (%) = yearly specific yield / 8,760 hours x 100.
How Do You Use the kWh per kWp Calculator?
- Choose how you know your system size: as kWp from your MCS certificate or quote, or as the number of panels and the watt rating of each panel.
- Enter the energy generated in kWh. Subtract an earlier generation meter reading from a later one.
- Enter the number of days between the two readings. Use 365 for a full year.
- Pick a benchmark. The default is the measured UK median for 2024/25. If you live elsewhere, type the yearly figure PVGIS gives for your address.
- Read the specific yield, the annualised value, the capacity factor and the verdict. Open the breakdown to see every step.
What Is a Good kWh per kWp in the UK?
A typical UK home system produces roughly 700 to 850 kWh per kWp per year, so anything above about 800 is a solid result. The government’s Feed-in Tariff load factor analysis for 2024/25, which is based on generation meter readings from small installations, puts the median solar load factor at 9.2%. That equals about 806 kWh per kWp. The weighted mean was lower at 8.3%, about 727 kWh per kWp, and 9.2% was the lowest median in the series, so 2024/25 was not a strong solar year.
The same analysis found south-west England, the east of England and the north-east highest at around 9.5% (about 832 kWh per kWp), with London lowest. These are fleet averages, so they include roofs facing east, west and partly shaded. A clean south-facing roof at a good pitch should beat the median. The Energy Saving Trust notes that east or west-facing panels typically get 15 to 20% less energy than south-facing ones, which you can test with our solar panel orientation calculator.
How Does kWh per kWp Compare Across Europe and the World?
Sunnier countries reach roughly 1,100 to 1,800 kWh per kWp per year, so a UK figure of 800 is normal and not a fault. The World Bank’s Global Photovoltaic Power Potential by Country study found that 93% of the world’s population lives in countries with an average practical potential of 3.0 to 5.0 kWh per kWp per day. It also names Ireland as the country with the lowest average potential in its ranking.
For any address in Europe, Africa or Asia, the free PVGIS tool from the European Commission gives a long-term yearly estimate for 1 kWp with your tilt and orientation. PVGIS uses a default of 14% overall system losses and also reports how much output varies from year to year. Type that yearly figure into the benchmark field and the calculator compares your real output with it directly.
| Benchmark | Per day (kWh/kWp) | Per year (kWh/kWp) | Capacity factor | Source |
|---|---|---|---|---|
| UK weighted mean 2024/25 | 1.99 | 727 | 8.3% | DESNZ FiT analysis |
| UK median 2024/25 | 2.21 | 806 | 9.2% | DESNZ FiT analysis |
| Best UK regions 2024/25 | 2.28 | about 832 | about 9.5% | DESNZ FiT analysis |
| Lower end of most of the world | 3.0 | about 1,096 | 12.5% | World Bank / ESMAP |
| Excellent PV countries | 4.5 | about 1,644 | 18.8% | World Bank / ESMAP |
| Upper end of most of the world | 5.0 | about 1,826 | 20.8% | World Bank / ESMAP |
Yearly figures use 365.25 days. World Bank values assume optimally tilted fixed panels, so they show the potential of a location, not the output of a typical roof.
Can You Work Out kWh per kWp From a Monthly Reading?
You can calculate it for any period, but only a full year gives a fair comparison with yearly benchmarks. In the UK a June can produce several times more than a December, so multiplying one summer month by twelve overstates the year by a wide margin. The calculator shows the annualised figure for a part-year period and warns you about this.
For month-by-month checks, compare like with like: your July against the PVGIS July value for your roof, or against your own July last year. If you want to estimate future output instead of checking past output, use the solar panel output calculator.
Why Is My kWh per kWp Lower Than Expected?
A result more than about 15% under a fair benchmark usually points to a fixable cause rather than bad luck with the weather. Work through these checks:
- Wrong numbers in: the export meter instead of the generation meter, or panel watts entered as kWp.
- Downtime: an inverter that tripped for weeks shows as a flat line in its app or log.
- Shading: trees and new buildings grow; even partial shade on one panel can pull down a whole string.
- Heat: panels lose power as they warm up, which our temperature loss calculator quantifies.
- Soiling: dirt, moss and bird droppings on low-pitch roofs.
- Clipping: an inverter much smaller than the array caps output on bright days.
The verdict bands in the tool are a Solaxyra rule of thumb, not a standard: 95% or more of the benchmark is in line, 85 to 95% is slightly low, and under 85% deserves a closer look. Any electrical inspection of the inverter or wiring must be done by a qualified installer or electrician.
Worked Example: Checking a 4.3 kWp Roof in Leeds
Sarah in Leeds has ten 430 W panels on a south-east roof. Her generation meter read 12,410 kWh on 1 September 2025 and 15,760 kWh on 1 September 2026.
- System size: 10 x 430 W = 4,300 W = 4.3 kWp.
- Energy generated: 15,760 minus 12,410 = 3,350 kWh over 365 days.
- Specific yield: 3,350 / 4.3 = 779 kWh per kWp.
- Capacity factor: 779 / 8,760 = 8.9%.
- Against the UK median of 806: 779 / 806 = 97%.
Sarah’s system sits close to the national median despite facing south-east, so there is no sign of a fault. If she wants to put a value on that output, the solar panel savings calculator converts it into money saved and export earnings.
Frequently Asked Questions
What is a good kWh per kWp figure in the UK?
Most UK home systems land between about 700 and 850 kWh per kWp per year. Government analysis of 2024/25 Feed-in Tariff meter readings found a median load factor of 9.2%, which works out at about 806 kWh/kWp. Well-sited south-facing roofs in the south of England often beat that.
Is kWh per kWp the same as specific yield?
Yes. Specific yield is the formal name for kWh per kWp. It is the energy produced over a period divided by the installed DC peak power, and for a full year it equals the number of hours the system would need to run at full rated power to make the same energy.
How do I convert kWh per kWp per day into a yearly figure?
Multiply the daily value by 365. A long-term average of 2.2 kWh/kWp per day equals about 803 kWh/kWp per year. Do not do this with a single summer or winter day, because daily output in the UK and northern Europe swings strongly between seasons.
Why is my specific yield lower than my installer’s estimate?
Common causes are shading that grows over the years, a weather year duller than average, inverter faults or downtime, dirty panels, clipping on an undersized inverter and reading the wrong meter. Compare month by month with the estimate to find when the gap opened.
Should I use the inverter reading or the generation meter?
Use the total generation meter if you have one, because it measures AC energy after the inverter, which is what you actually use or export. Inverter app totals can differ slightly from the meter. Never use the export meter, which leaves out everything the house consumed.
How does kWh per kWp relate to capacity factor?
Capacity factor is yearly kWh per kWp divided by 8,760 hours in a year. A specific yield of 806 kWh/kWp is a capacity factor of 9.2%. Government statistics often call the same figure a load factor.
Checked October 2026 by the Solaxyra Editorial Team. Sources: DESNZ Feed-in Tariff load factor analysis 2024/25, European Commission JRC PVGIS user manual, World Bank Global Photovoltaic Power Potential by Country, Energy Saving Trust solar panels guide.