Bar shows output in the final year as a share of output when new. Weather changes yearly output far more than degradation, so compare like with like.
Formula and breakdown
n/a
n/a
n/a
This solar panel degradation calculator estimates how much electricity a solar PV system will produce in any future year as its panels slowly lose power, how much generation and money that loss costs over the system's life, and whether the result stays within the panel maker's performance warranty. It is set up for UK and European homes, with a UK price default and a euro option.
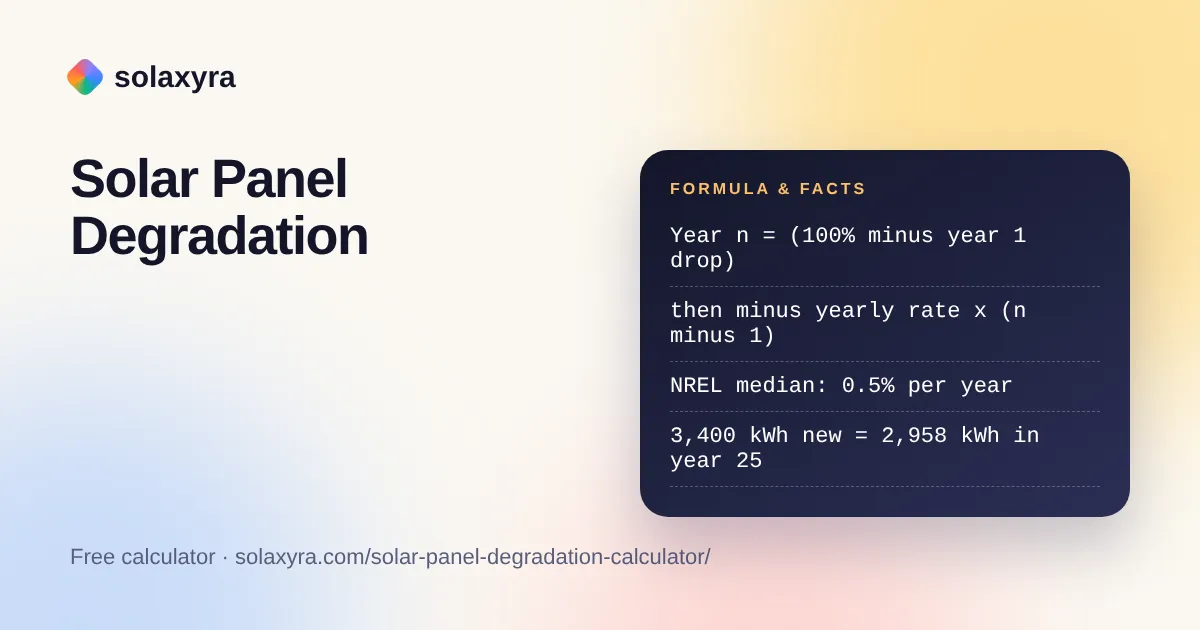
Quick answer: A solar panel degradation calculator applies a first-year drop and a yearly loss rate to your system's output when new. At the NREL median of 0.5% a year plus an example 1% first-year drop, a system making 3,400 kWh when new makes about 2,958 kWh in year 25, or 87%.
What Is a Solar Panel Degradation Calculator?
A solar panel degradation calculator is a tool that projects the gradual fall in a PV system's output over the years from its output when new and an assumed rate of loss. In plain words: output in year n equals the output when new multiplied by the share of power left that year, where the share starts at 100% minus the first-year drop and then falls by the yearly degradation rate.
The solar panel degradation calculator offers two ways of applying that yearly rate. The linear model takes the same number of percentage points off every year, the same straight-line form as warranty terms written as a minimum after year 1 plus a maximum yearly drop. The compound model takes a percentage of the previous year's output, so each year's loss is slightly smaller. At 0.5% a year the two differ by under 1 percentage point after 25 years.
How Do You Use the Solar Panel Degradation Calculator?
- Choose the linear or compound model.
- Enter the yearly output you expect from the system when new. If you do not have a figure, the PVGIS tool from the European Commission's Joint Research Centre estimates it for your location, as does our solar panel output calculator.
- Set the first-year drop and the yearly degradation rate. The defaults are a 1% example and the 0.5% NREL median.
- Choose how many years to look ahead and the value of each kWh to you.
- Copy the performance warranty terms from your panel datasheet: the minimum power after year 1, the maximum yearly drop after that and the warranty length.
- Read the output in the final year, the lifetime loss, the year output falls below 80% and the warranty check, then scan the year-by-year rows.

How Much Do Solar Panels Degrade Each Year?
A widely cited NREL review of nearly 2,000 measured degradation rates from modules and whole systems found a median of 0.5% per year. The record of that NREL analytical review on OSTI.gov summarises the finding. A median means half of the measurements were higher and half lower, so your panels may age faster or slower depending on the product, the installation and the climate.
The first year can be treated separately: enter the first-year drop your datasheet warranty or installer gives, or test a range. Neither figure can be known exactly in advance, so both are editable and the defaults are labelled as examples.
How Much Output Is Left After 25 Years?
At 0.5% a year after a 1% first-year drop, about 87% of the original output is left in year 25 on the linear model and 87.8% on the compound model. The table shows three yearly rates for a system expected to produce 3,400 kWh a year when new, with a 1% first-year drop and electricity valued at 26.32p per kWh.
| Yearly rate and model | Year 25 output | Share in year 25 | Share in year 30 | 25-year kWh lost | Value lost | First year below 80% |
|---|---|---|---|---|---|---|
| 0.25%, linear | 3,162 kWh | 93.0% | 91.8% | 3,400 | £894.88 | Year 78 |
| 0.25%, compound | 3,170 kWh | 93.2% | 92.1% | 3,327 | £875.61 | Year 87 |
| 0.5%, linear | 2,958 kWh | 87.0% | 84.5% | 5,950 | £1,566.04 | Year 40 |
| 0.5%, compound | 2,984 kWh | 87.8% | 85.6% | 5,711 | £1,503.05 | Year 44 |
| 0.8%, linear | 2,713 kWh | 79.8% | 75.8% | 9,010 | £2,371.43 | Year 25 |
| 0.8%, compound | 2,776 kWh | 81.6% | 78.4% | 8,454 | £2,225.10 | Year 28 |
Values lost assume a flat electricity price with no inflation. If you export a large share of your generation, use a blended value per kWh between your import price and your export rate.
How Do I Check Degradation Against My Panel Warranty?
Compare the modelled share of power in a given year with the warranty line on your panel datasheet: the minimum power promised after year 1, minus the maximum yearly drop for each year after that. The solar panel degradation calculator draws that line from the three warranty figures you enter and says whether the model sits above or below it.
A warranty covers the panels' measured power, not the kWh your system generates. Yearly generation can vary with the weather by much more than a year's degradation, so a weak year is not proof of faulty panels. If you suspect a problem, compare like-for-like months over several years, check for shading, soiling and inverter faults, and ask your installer to test the panels. Any work on the roof or the array should be done by a competent installer, and any electrical work by a qualified electrician (in the UK, to BS 7671).
Does Degradation Change Solar Payback?
Yes, but only modestly at typical rates: at 0.5% a year with a 1% first-year drop, degradation removes about 7% of 25-year generation compared with panels that never aged. That lost output pushes payback slightly later and lowers lifetime savings. Our solar payback calculator includes a degradation input, and the solar ROI calculator shows the effect over a 25-year cash flow.
Worked Example: 4 kWp Roof System Over 25 Years
Example: a 4 kWp system on a south-facing roof in Birmingham is estimated to produce 3,400 kWh a year when new. The owner assumes a 1% first-year drop, then 0.5% a year on the linear model, values each kWh at 26.32p, and has a datasheet warranty of 98% after year 1 and 0.55% a year after that for 25 years (example terms).
- Share of power in year 25: 100% minus 1% = 99%, then 99% minus 0.5% x 24 = 87%.
- Output in year 25: 3,400 x 0.87 = 2,958 kWh.
- Total over 25 years: 3,400 x (25 x 0.99 minus 0.005 x 300) = 3,400 x 23.25 = 79,050 kWh, against 85,000 kWh with no degradation.
- Lost output: 5,950 kWh, worth 5,950 x £0.2632 = £1,566.04.
- Warranty line in year 25: 98% minus 0.55% x 24 = 84.8%. The modelled 87% is above it.
- Output first falls below 80% in year 40.
Frequently Asked Questions
How do I calculate solar panel degradation?
Start from 100%, take off the first-year drop, then take off the yearly rate for each later year. On a linear model, year 25 with a 1% first-year drop and 0.5% a year gives 99% minus 0.5% x 24 = 87%. Multiply that share by the output when new.
What is a normal solar panel degradation rate?
An NREL review of nearly 2,000 measured rates found a median of 0.5% per year. Individual products and sites vary, so use the rate on your panel's datasheet warranty as a ceiling and test a few rates in the calculator to see the range of outcomes.
Is solar panel degradation linear or compound?
Both models are used. The linear model takes the same percentage points off each year, matching warranty terms written as a minimum after year 1 plus a maximum yearly drop. The compound model takes a percentage of the previous year. At 0.5% a year they differ by under 1 percentage point after 25 years.
How long do solar panels last before dropping to 80%?
At 0.5% a year after a 1% first-year drop, output stays at or above 80% until about year 40 on the linear model. At a faster 0.8% a year it falls below 80% around year 25. The calculator shows the year for any rates you enter.
Why is my solar generation lower than last year?
Often because of weather. Sunshine varies from year to year, and that can outweigh a year of panel ageing. Before blaming degradation, compare several years of like-for-like months, and check for new shading, dirt, inverter faults or an export limit. Ask your installer to test the panels if the drop persists.
Does degradation affect my warranty claim?
Only if the panels' measured power falls below the warranty line on the datasheet. Warranties cover tested power, not yearly kWh, so a claim normally needs a proper performance test. Keep your datasheet, invoice and generation records, and contact your installer or the manufacturer.
Checked October 2026 by the Solaxyra Editorial Team. Sources: NREL: Photovoltaic Degradation Rates, An Analytical Review (OSTI record), European Commission JRC: PVGIS, Ofgem: Energy price cap 1 October to 31 December 2026.