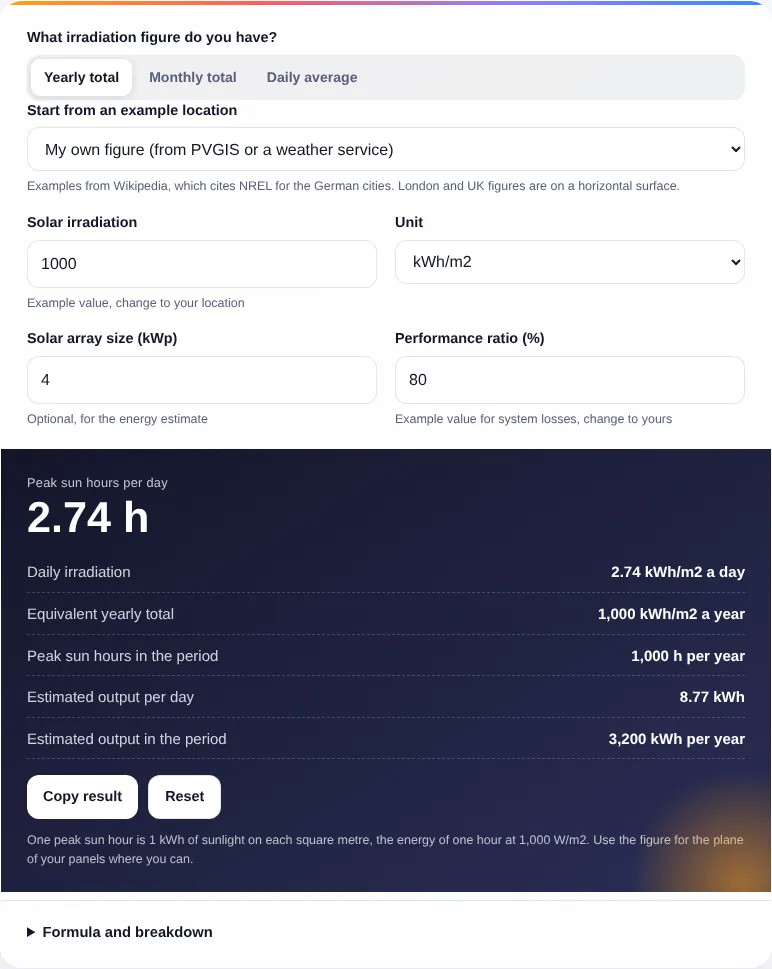
One peak sun hour is 1 kWh of sunlight on each square metre, the energy of one hour at 1,000 W/m2. Use the figure for the plane of your panels where you can.
Formula and breakdown
n/a
n/a
n/a
This peak sun hours calculator turns a yearly, monthly or daily solar irradiation figure into peak sun hours per day, and estimates how much electricity a solar array would produce, for home owners, installers and off-grid users in the UK, Ireland and Europe. It accepts kWh/m2, Wh/m2 or MJ/m2, handles the number of days in each month and includes labelled examples for London, Bremen and Stuttgart.
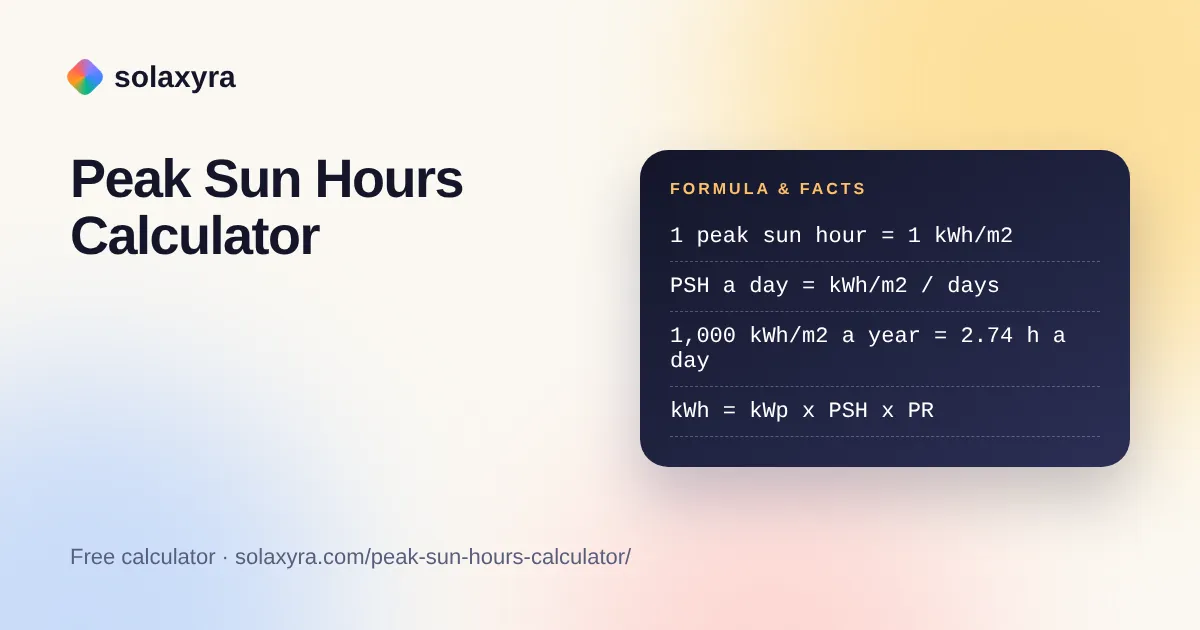
Quick answer: A peak sun hours calculator divides solar irradiation in kWh/m2 by the number of days in the period. A location receiving 1,000 kWh/m2 a year has 1,000 / 365 = 2.74 peak sun hours a day. One peak sun hour equals 1 kWh of sunlight per square metre, an hour at 1,000 W/m2.
What Is a Peak Sun Hours Calculator?
A peak sun hours calculator converts the total solar energy that falls on a square metre over a period into the equivalent number of hours of full sunshine at 1,000 W/m2. In plain words: peak sun hours per day equal the irradiation in kWh/m2 divided by the number of days it covers.
The conversion is simple because of the unit chosen. PV Education, the online textbook on photovoltaics, explains that average daily insolation in kWh/m2 is numerically the same as peak sun hours, since peak solar radiation is taken as 1 kW/m2. A day with 3 kWh/m2 of sunlight therefore counts as 3 peak sun hours, even if the sun was above the horizon for 14 hours at lower strength. Solar panels are rated at that same 1,000 W/m2, so peak sun hours multiply neatly with a panel’s rated power.
How Do You Use the Peak Sun Hours Calculator?
- Choose whether your figure is a yearly total, a monthly total or a daily average.
- Enter the irradiation and pick its unit. Weather services often give MJ/m2; the peak sun hours calculator divides by 3.6 to get kWh/m2.
- For a monthly figure, choose the month so the peak sun hours calculator divides by the right number of days.
- Or pick an example location to see how the numbers compare.
- Optionally enter your array size in kWp and a performance ratio to estimate daily and period output.
- Open the formula breakdown to check each step.
Where Do I Find Irradiation Data for My Location?
The free PVGIS tool from the European Commission’s Joint Research Centre gives solar radiation data for any location except the poles, without registration. It can return monthly irradiation on a horizontal plane and on a tilted plane, which you can paste straight into this peak sun hours calculator in monthly mode.
Use the irradiation on the plane of your panels when it is available. At UK and northern European latitudes, horizontal figures usually understate what a south-facing panel tilted towards the sun receives, especially in winter, so a horizontal value gives a cautious result. Our solar panel angle calculator helps you choose the tilt to use when you request data.
How Many Peak Sun Hours Does the UK Get?
The UK receives about 750 to 1,100 kWh/m2 of solar energy a year, which works out at roughly 2.1 to 3.0 peak sun hours a day on average, according to the Wikipedia article on solar power in the United Kingdom. The same article gives London about 0.52 kWh/m2 a day in December and 4.74 kWh/m2 a day in July on a horizontal surface, a ninefold swing.
The table converts yearly totals into daily peak sun hours, and shows the yearly yield per kWp at an example performance ratio of 80%.
| Yearly irradiation (kWh/m2) | Peak sun hours a day | Yield per kWp a year at 80% (kWh) |
|---|---|---|
| 750 | 2.05 | 600 |
| 900 | 2.47 | 720 |
| 1,000 | 2.74 | 800 |
| 1,100 | 3.01 | 880 |
| 1,500 | 4.11 | 1,200 |
| 2,000 | 5.48 | 1,600 |
How Do Peak Sun Hours Change Through the Year?
In northern Europe, peak sun hours in midsummer are often several times the midwinter figure, so a yearly average hides most of the story. The comparison below uses the example figures in the calculator and a 4 kWp array at an 80% performance ratio.
| Example location and period | Peak sun hours a day | Output a day from 4 kWp (kWh) |
|---|---|---|
| London, December (horizontal) | 0.52 | 1.66 |
| London, July (horizontal) | 4.74 | 15.17 |
| Bremen, yearly average (NREL) | 2.92 | 9.34 |
| Stuttgart, yearly average (NREL) | 3.33 | 10.66 |
For off-grid systems and campervans, size the panels on the worst month you need power in, not the yearly average. The off-grid solar calculator asks for exactly that worst-month figure.
Are Peak Sun Hours the Same as Hours of Sunshine?
No: hours of sunshine count how long the sun shines brightly, while peak sun hours measure the total energy received, expressed as hours at 1,000 W/m2. A long summer day of hazy sun can add up to fewer peak sun hours than its length suggests, and a short winter day with a low sun adds very little energy.
Wikipedia’s article on solar irradiance notes that maximum irradiance at sea level on a clear day is about 1,000 W/m2, which is why that value is the reference. Sunshine duration records from weather stations are useful for climate comparisons, but they cannot be multiplied by panel power to get kWh.
How Do You Turn Peak Sun Hours Into Solar Panel Output?
Multiply array size in kWp by peak sun hours and by a performance ratio: a 4 kWp array with 2.74 peak sun hours and an 80% ratio makes about 8.8 kWh a day. The performance ratio covers losses from heat, wiring, inverter conversion, dirt and shading; the 80% default is an example, so replace it with the figure from your installer or design software.
To go further, the solar panel output calculator works out monthly and yearly generation with country defaults, and the kWh per kWp calculator lets you compare a real system’s yield against these estimates.
Worked Example: Peak Sun Hours From a Yearly Irradiation Figure
Example: a home in the south of England has a yearly irradiation of 1,000 kWh/m2 on the plane of its roof, taken from PVGIS, and plans a 4 kWp array. The installer’s example performance ratio is 80%.
- Peak sun hours a day: 1,000 / 365 = 2.74 h.
- Output a day: 4 kWp x 2.74 h x 0.80 = 8.77 kWh.
- Output a year: 8.77 x 365 = 3,200 kWh, which is 800 kWh per kWp.
- December check: if the December figure were the London horizontal value of 0.52 kWh/m2 a day, the array would make about 1.66 kWh a day, so winter planning needs the monthly figures.
Frequently Asked Questions
How do you calculate peak sun hours?
Divide the solar irradiation in kWh/m2 by the number of days it covers. A yearly total of 1,000 kWh/m2 divided by 365 gives 2.74 peak sun hours a day. A daily figure in kWh/m2 is already the peak sun hours number, because one peak sun hour is 1 kWh/m2.
How many peak sun hours does London get?
London receives about 0.52 kWh/m2 a day in December and 4.74 kWh/m2 a day in July on a horizontal surface, so roughly 0.5 to 4.7 peak sun hours a day across the year. A tilted, south-facing panel receives more, especially in winter, so check PVGIS for your roof.
How do I convert MJ/m2 to peak sun hours?
Divide MJ/m2 by 3.6 to get kWh/m2, because 1 kWh equals 3.6 MJ, then divide by the number of days. A daily total of 10 MJ/m2 equals 2.78 kWh/m2, which is 2.78 peak sun hours. Select MJ/m2 in the unit list and the calculator does this for you.
Is 3 peak sun hours good for solar?
Three peak sun hours a day matches the sunny end of the UK range and the NREL yearly averages for Bremen and Stuttgart, places where many solar systems run well. A 4 kWp array at an 80% example performance ratio would make about 9.6 kWh a day on average, with far more in summer than winter.
Should I use horizontal or tilted irradiation?
Use the irradiation on the plane of your panels where possible, because that is the sunlight they actually receive. PVGIS offers both horizontal and tilted values. Horizontal data gives a cautious answer for panels tilted towards the sun, and can overstate output for panels facing away from it.
Why does my solar system make less than peak sun hours suggest?
Peak sun hours describe the sunlight, not the system. Real output is lower because of heat, inverter and wiring losses, dirt, shading and panel ageing, which together form the performance ratio. If yield is far below the estimate, check for shading, faults or a tripped inverter with your installer.
Checked October 2026 by the Solaxyra Editorial Team. Sources: PV Education: Average solar radiation, Wikipedia: Solar power in the United Kingdom, Wikipedia: Solar power in Germany (NREL sun hours), Wikipedia: Solar irradiance, European Commission JRC: PVGIS.