Long-term average for a typical year. Real output changes from year to year with the weather.
Formula and breakdown
n/a
n/a
n/a
This solar panel output calculator estimates how many kWh a solar panel system will generate per day, per month and per year, for homes in the UK, Ireland and across Europe, or anywhere else if you know your local peak sun hours. Enter your panels or total kWp, choose your region and roof direction, and you get a monthly profile as well as the yearly total.
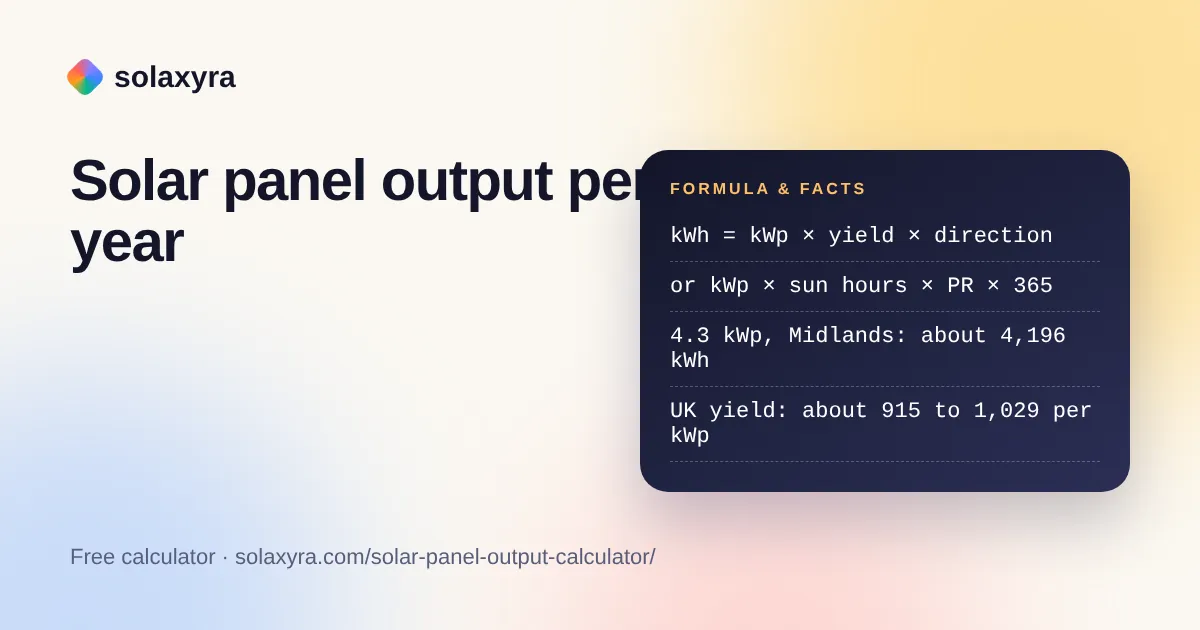
Quick answer: A solar panel output calculator multiplies system size in kWp by the yearly kWh each kWp produces locally. A 4.3 kWp south-facing system in the English Midlands makes about 4,196 kWh a year, or 11.5 kWh a day on average, ranging from about 16.6 kWh on a July day to 4.6 kWh in December.
What Is a Solar Panel Output Calculator?
A solar panel output calculator is a tool that predicts the electricity a solar array will produce over a day, month or year from its size, location and orientation. The formula in plain words: output equals system size in kWp, times peak sun hours on the panel surface, times the performance ratio, times the number of days. When a location yield is used, the sun hours and performance ratio are already rolled into one figure, so output simply equals kWp times yield times a direction factor.
Peak sun hours are the daily solar energy reaching the panel surface, expressed as the number of hours of full 1,000 W per m² sunshine that would deliver the same energy. The performance ratio is the share of that ideal energy that actually reaches your consumer unit after losses from heat, wiring, the inverter, dirt and mismatch. The EU’s PVGIS user manual suggests a 14% overall system loss as a starting value when you do not know your system’s details.
How Do You Use the Solar Panel Output Calculator?
- Enter your system as panels (wattage and number) or switch to total kWp if you already know it.
- Choose “My location” to use regional yields from the World Bank Global Solar Atlas, or “Custom peak sun hours” to enter your own sun hours and performance ratio.
- Pick the direction your panels face. The factors are modelled for a 35° roof.
- Add a percentage for shading, and enter the panel age if you want to allow for gradual wear. The calculator uses an example rate of 0.5% a year, which you can avoid by entering 0.
- Read the yearly, monthly and daily figures, and open the breakdown to check each step.
How Much Does a Solar Panel Produce per Day?
In the UK each kWp of south-facing panels produces about 2.5 to 2.8 kWh per day averaged over the year, so a single 430 W panel makes a little over 1 kWh a day. The daily figure swings widely with the seasons: about 3.8 to 4.1 kWh per kWp on a June day in the UK, but only about 0.8 to 1.1 kWh in December. Southern Europe sees roughly 4.2 to 4.5 kWh per kWp per day across the year.
The table lists the yearly yield and the average daily output per kWp in June and December for a sample of regions, using Global Solar Atlas figures for panels at the best fixed angle facing south.
| Region | kWh per kWp per year | Average per day | June day | December day |
|---|---|---|---|---|
| London and South East | 1,029 | 2.8 | 4.1 | 1.1 |
| Midlands (Birmingham) | 976 | 2.7 | 3.9 | 1.1 |
| North West (Manchester) | 920 | 2.5 | 3.8 | 0.9 |
| Scotland (Edinburgh) | 915 | 2.5 | 3.8 | 0.8 |
| Ireland (Dublin) | 967 | 2.6 | 3.9 | 1.0 |
| Netherlands (Amsterdam) | 1,049 | 2.9 | 4.3 | 1.0 |
| Germany (Frankfurt) | 1,105 | 3.0 | 4.5 | 1.0 |
| France (Paris) | 1,141 | 3.1 | 4.4 | 1.3 |
| Italy (Rome) | 1,532 | 4.2 | 5.4 | 2.6 |
| Spain (Madrid) | 1,655 | 4.5 | 5.5 | 3.0 |
How Many Peak Sun Hours Does the UK Get?
A well-angled south-facing panel in the UK receives roughly 2.8 to 3.2 peak sun hours a day averaged over the year, according to our model built on Global Solar Atlas monthly sunlight data. That rises to about 4.5 to 5 hours in midsummer and falls to about 1 hour or less in December, with Scotland seeing the lowest winter figures. Central Germany and northern France get about 3.4 to 3.6 hours on average, and Madrid about 5.3.
Peak sun hours are not the same as daylight hours or hours of sunshine. A long, hazy June day can deliver fewer peak sun hours than its length suggests, while a short, clear spring day can deliver more. If you take sun hours from another source, check that they are for a tilted panel rather than flat ground, because the two can differ by more than 10%.
What Reduces Solar Panel Output?
The biggest reducers are orientation, shading and heat, followed by dirt, cable and inverter losses, and slow ageing of the panels. An east or west roof produces about 83% of a south roof, and a north roof about 64%. Partial shade can cut output by much more than the shaded area suggests, because shaded cells limit the current of the whole string unless the system has optimisers or microinverters.
Heat matters because crystalline panels lose efficiency as they get hotter. The PVGIS manual notes that panels with restricted airflow behind them can run up to 15°C hotter in strong sunlight, which reduces output. Clean, well-ventilated panels on an unshaded roof perform closest to the regional figures. To test angles in more detail, use the solar panel angle calculator; to compare your actual meter readings with these benchmarks, use the kWh per kWp calculator.
Worked Example: Aisha in Birmingham
Aisha has ten 430 W panels on a south-facing roof in Birmingham with no shading. She wants to know what they should produce so she can check her inverter app.
- System size: 10 × 430 W = 4.30 kWp.
- Yearly output: 4.30 kWp × 976 kWh per kWp = about 4,196 kWh.
- Average day: 4,196 ÷ 365 = about 11.5 kWh.
- Best months: about 517 kWh in May and 514 kWh in July. Weakest month: about 142 kWh in December.
- Per panel: about 420 kWh a year.
Her installer quoted peak sun hours of 3 and a performance ratio of 85%. In custom mode that gives 4.30 × 3 × 0.85 × 365 = about 4,002 kWh, within 5% of the regional estimate. If her meter shows much less over a full year, shading, a fault or a tripped inverter is worth checking. To turn the output into money, she can use the solar savings calculator.
Frequently Asked Questions
How many kWh does a 4 kW solar system produce in the UK?
A 4 kWp south-facing system produces about 3,660 to 4,120 kWh a year in the UK, using regional yields of 915 to 1,029 kWh per kWp. That is about 10 to 11 kWh a day on average, with summer days well above that and December days far below it.
How do you calculate solar panel output?
Multiply the system size in kWp by the yearly yield in kWh per kWp for your location, then adjust for direction and shading. Alternatively, multiply kWp by daily peak sun hours, by a performance ratio such as 0.85, and by 365 days to get yearly kWh.
What is a good performance ratio for solar panels?
A performance ratio describes how much of the ideal output reaches your home after losses. Our regional figures imply roughly 85% to 90% for a modern, well-angled system. If you are unsure, start with 85% and lower it for hot roofs, dirty panels or older equipment.
How much does a solar panel produce in winter?
In the UK a south-facing panel produces roughly a quarter of its June daily output in December, or less in Scotland. Each kWp gives about 0.8 to 1.1 kWh on an average December day, compared with about 3.8 to 4.1 kWh in June. Southern Europe keeps about half its summer output in winter.
Why is my solar output lower than the calculator says?
Common reasons are shading that the calculator does not know about, a duller than average year, dirty panels, a different roof angle or direction than selected, or an inverter fault. Compare full months rather than single days, because daily output varies a lot with the weather.
Does the panel wattage tell me the output?
Only partly. The wattage is the power under standard test conditions of 1,000 W per m² at 25°C, which panels rarely see on a roof. Real output depends on how much sunlight reaches the panel each day, its temperature and system losses, which is what this calculator estimates.
Checked October 2026 by the Solaxyra Editorial Team. Sources: Global Solar Atlas (World Bank), PVGIS user manual (EU Joint Research Centre), PVGIS overview.