This guide shows UK homeowners and plug-in solar users how much electricity solar panels really produce from October to February, why output falls, how it differs from Cornwall to Shetland, and what you can do about it. Instead of the rough percentages often quoted, it uses measured government data on solar panel output in winter UK installations achieve, plus sun-angle figures for each region worked out from standard solar geometry.
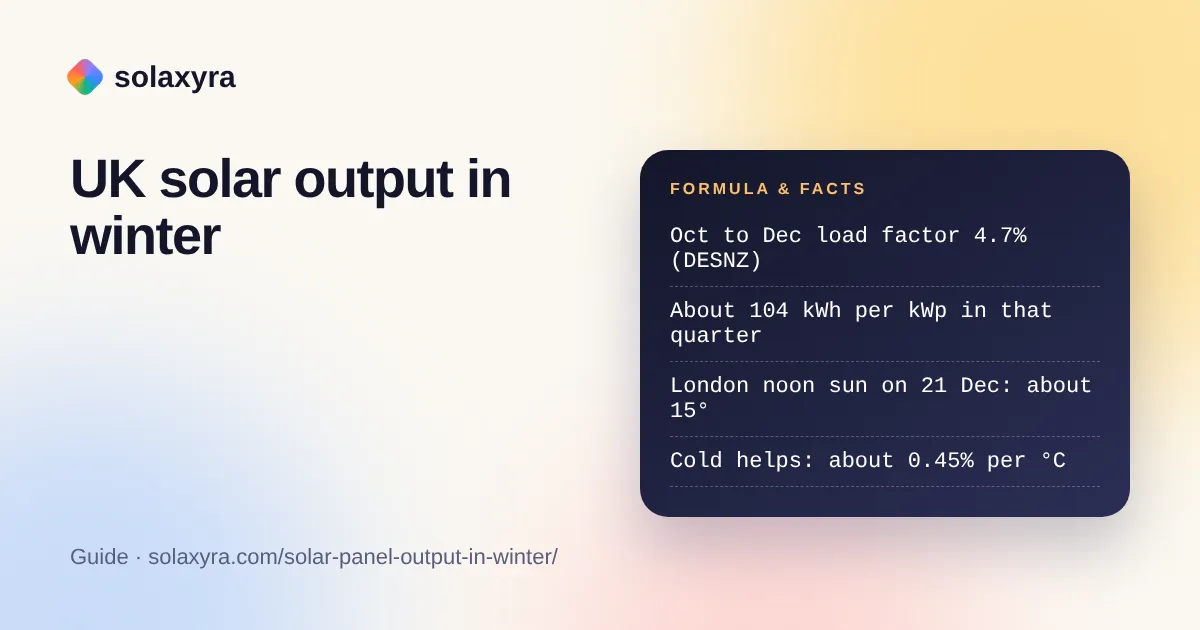
Quick answer: Solar panel output in winter UK systems achieve is roughly a third of spring output. Government data from over 280,000 installations show a load factor of 4.7% from October to December 2024, against 13.6% from April to June. That equals about 104 kWh per kWp over the quarter, around 1.1 kWh per kWp a day.
How Much Do Solar Panels Produce in Winter in the UK?
A UK solar system produces about 104 kWh for every kWp of panels between October and December, compared with about 297 kWh per kWp between April and June. Those figures come from the DESNZ Feed-in Tariff load factor analysis for 2024/25, which uses meter readings from 282,047 solar installations. A load factor is the energy a system actually produces divided by what it would produce running at full rated power all the time.
To turn a load factor into kWh, multiply it by the hours in the period and the system size. The arithmetic is shown so you can check it:
| Period (DESNZ data) | Load factor | Hours in period | kWh per kWp in period | kWh per kWp per day |
|---|---|---|---|---|
| April to June 2024 | 13.6% | 2,184 | about 297 | about 3.3 |
| October to December 2024 | 4.7% | 2,208 | about 104 | about 1.1 |
| Whole year 2024/25 (median) | 9.2% | 8,760 | about 806 | about 2.2 |
National generation tells the same story. DESNZ Energy Trends reports that UK solar generated 2.1 TWh from October to December 2025, out of a record 20.0 TWh for the whole of 2025, so the last quarter supplied only about 10.5% of the year’s solar power. The April to June 2025 quarter produced 8.4 TWh, four times as much.
Keep in mind that the October to December figures include October, which is much brighter than December. December on its own, and January, are the weakest months, so a single dull week in midwinter can produce well under the quarterly average.
Why Do Solar Panels Produce Less in Winter?
Winter output falls mainly because the days are shorter and the sun is low, not because of the cold. On 21 December the sun in London rises only about 15° above the horizon at noon, compared with about 62° in June, and the day is roughly 7 hours 35 minutes long rather than 16 hours 25 minutes.
A low sun hurts in three ways. Its light travels through more atmosphere before it reaches you, so less arrives. It strikes a typical roof at a glancing angle, so each square metre of panel intercepts less of it. And it casts long shadows, so trees, chimneys and neighbouring buildings that never matter in summer can shade panels for much of a winter day. Thick cloud, more common in winter, then reduces what is left to mostly diffuse light.
Cold, on the other hand, helps. Solar cells become more efficient as they cool: according to published data on solar cell efficiency, each 1 °C rise in cell temperature cuts efficiency by about 0.45%, so the reverse also applies. Example: a panel with cells at 5 °C works about 9% more efficiently than at the 25 °C standard test temperature (20 °C times 0.45%). Our temperature loss calculator shows the effect for your panel’s own coefficient.
How Does Winter Output Vary Across the UK?
The further north you live, the lower the winter sun and the shorter the day: on 21 December the noon sun reaches about 16° above the horizon in Plymouth but only about 11° in Edinburgh and 6° in Lerwick. The table applies two standard equations, noon elevation equals 90° minus the difference between latitude and the sun’s declination (minus 23.44° at the December solstice), and the sunrise equation for day length.
| Location | Latitude | Noon sun height, 21 December | Noon sun height, 21 June | Day length, 21 December | Day length, 21 June |
|---|---|---|---|---|---|
| Plymouth | 50.4° N | 16.2° | 63.1° | 7 h 47 min | 16 h 13 min |
| London | 51.5° N | 15.0° | 61.9° | 7 h 35 min | 16 h 25 min |
| Birmingham | 52.5° N | 14.1° | 61.0° | 7 h 25 min | 16 h 35 min |
| Manchester | 53.5° N | 13.1° | 60.0° | 7 h 13 min | 16 h 47 min |
| Belfast | 54.6° N | 12.0° | 58.8° | 6 h 59 min | 17 h 1 min |
| Edinburgh | 56.0° N | 10.6° | 57.5° | 6 h 41 min | 17 h 19 min |
| Aberdeen | 57.2° N | 9.4° | 56.3° | 6 h 23 min | 17 h 37 min |
| Lerwick | 60.2° N | 6.4° | 53.3° | 5 h 28 min | 18 h 32 min |
Day lengths are geometric, from the sun’s centre crossing the horizon; actual daylight is a few minutes longer because the atmosphere bends light. The pattern explains why northern systems show a bigger gap between summer and winter, even where yearly totals are similar: Scotland gains long summer days but loses more in midwinter. For a month-by-month estimate at your own location, the solar panel output calculator uses regional yield data.
Does Panel Angle Matter More in Winter?
Yes. In December a steep panel catches far more direct sunlight than a shallow one: at London’s 15° noon sun, a south-facing panel tilted at 60° or hung vertically intercepts about 97% of the direct beam, a 35° roof about 77%, and a flat panel only about 26%. In June the order reverses, and a vertical panel catches less than half.
| Panel tilt (facing south) | Direct noon sunlight captured, 21 December, London | Direct noon sunlight captured, 21 June, London |
|---|---|---|
| 0° (flat) | 26% | 88% |
| 15° | 50% | 97% |
| 30° | 71% | 100% |
| 35° (typical roof) | 77% | 99% |
| 45° | 87% | 96% |
| 60° | 97% | 85% |
| 90° (vertical railing or wall) | 97% | 47% |
The figures are the cosine of the angle between the sun’s rays and the panel’s face at solar noon. They cover direct light only; on overcast days diffuse light from the whole sky dominates and the advantage of a steep panel shrinks. Even so, it explains why vertical balcony kits lose less in winter than in summer. You cannot re-angle most roof systems, but if you are choosing a stand for a plug-in kit, the solar panel angle calculator gives the best fixed and seasonal tilts for your latitude.
How Much Will a Typical System Make This Winter?
Example: a 4 kWp south-facing roof system producing at the national October to December load factor of 4.7% would make about 415 kWh over the quarter, or about 4.5 kWh a day, compared with about 1,188 kWh (about 13 kWh a day) from April to June. That is the arithmetic of 4 kWp times 2,208 hours times 0.047.
In winter, output is small compared with household demand, so most of it is likely to be used at home rather than exported. Valued at the Ofgem price cap rate of 26.32p per kWh for 1 October to 31 December 2026, the example’s 415 kWh is worth about £109 if all of it is used at home.
Example: an 800 W plug-in kit at the same load factor would make about 83 kWh from October to December, under 1 kWh a day on average, worth about £22 at 26.32p. The national data come mainly from roof systems, so a well-angled kit could do a little better in winter and a shaded one worse. To model your own kit, use the plug-in solar calculator.
How Can You Get More From Solar Panels in Winter?
The biggest gains come from using power while the sun is up and removing winter-only shading; cleaning and battery choices matter less.
- Run the dishwasher, washing machine and other timed loads in the middle of the day, when the low sun is highest.
- Check for new shade from trees, scaffolding or neighbouring extensions; long winter shadows reach further than you expect.
- Check your inverter app or generation meter weekly; a fault is easy to miss when output is low anyway.
- If you have a battery, expect winter solar to fill only part of it; if your system and tariff allow, charging from the grid at an off-peak rate can cover the gap, and the battery size calculator helps you plan.
- Do not oversize a system for winter alone; extra panels mostly add summer surplus.
What Should You Do About Snow and Frost on Solar Panels?
Leave it to melt or slide off on its own, because the lost output in midwinter is small and the risk of clearing it is not. Never climb onto a roof or lean a ladder against panels to clear snow. Working at height on icy roofs is dangerous, so if snow stays for long periods, ask your installer or a competent roofing professional, and use only cleaning methods your panel manufacturer approves. For ground-level or plug-in panels, a soft brush is usually enough, provided you can reach them safely.
Frequently Asked Questions
Do solar panels work in winter in the UK?
Yes. They produce less because days are short and the sun is low, but they still generate. Government data from over 280,000 UK installations show a load factor of 4.7% from October to December 2024, about 104 kWh per kWp over the quarter.
What percentage of solar output is produced in winter?
Very little. In 2025, UK solar generated 2.1 TWh from October to December out of 20.0 TWh for the year, about 10.5%, according to DESNZ Energy Trends. December and January are the weakest months, so midwinter output alone is lower still.
How many kWh does a 4 kWp solar system produce in December?
At the national October to December load factor of 4.7%, a 4 kWp system averages about 4.5 kWh a day. December is below that quarterly average, so expect less on many days, with occasional bright, cold days producing more.
Does cold weather reduce solar panel output?
No. Cold improves efficiency: each 1 °C fall in cell temperature raises efficiency by about 0.45%. Winter output is lower because of short days, low sun and cloud, not the temperature itself.
Should I clear snow off my solar panels?
Not from a roof. Midwinter output is small anyway, and climbing on an icy roof is dangerous. If snow stays for a long time, ask your installer or a competent roofing professional, and follow the panel manufacturer’s cleaning advice.
Do vertical panels work better in winter?
For direct sunlight, yes. At London’s 15° midwinter noon sun, a vertical south-facing panel catches about 97% of the direct beam, while a 35° roof catches about 77%. In summer the vertical panel catches less than half, so it produces less over a year.
Checked October 2026 by the Solaxyra Editorial Team. Sources: DESNZ Feed-in Tariff load factor analysis 2024/25, DESNZ Energy Trends March 2026, DESNZ Energy Trends September 2026, Solar zenith angle, Sunrise equation, Axial tilt, Solar cell efficiency, Ofgem price cap October to December 2026.